mandara
Performance
Mandara’s resource use depends on the display size, graphics driver, widgets and open panels. Settled memory and startup peaks are different measurements. The goal of staying below 100 MiB throughout startup is not met yet.
Historical release-profile measurements
These measurements include the removed process-wide page advice and executable-cache discard. They do not establish a ceiling for current builds; current RSS can differ. Both cleanup paths are now removed because mappings can change during a procfs scan and forced cache discard caused disk faults. The tuned glibc allocator and post-eviction trim hook remain active.
Measured on 2026-11-06 with source 4b60bd5e4541 (the code merged for
v0.19.0), the normal optimized release profile, fat LTO and the tuned system
allocator. Each run used a fresh private home and the same warm shader cache.
The headless output was 3840 × 2160 at scale 1.5, with 23 active plugins out
of 77 registered. The fixture exercised the bar, sidebar, selected panels,
twenty notification-history entries and theme edits. The private session ran
offline with its system bus disabled, so real network, power and Bluetooth
services were not exercised. Integrations had no configured accounts or feeds;
this does not measure every plugin or an active video wallpaper.
| Measurement | Result |
|---|---|
| Startup peak RSS, three runs | Under 175 MiB |
| Settled bar RSS | Under 50 MiB |
| RSS after the panel and theme workload | Under 100 MiB |
| Video memory after that workload | Under 210 MiB |
| Threads after that workload | 27 |
| Typical sampled frame-build time | About 0.1 ms |
These figures include program code and shared libraries resident in the shell process. Studio runs separately. The headless output was configured for 144 Hz; this is not verification on a physical 144 Hz display. Frame-build timing measures CPU work and does not establish a display refresh-rate limit. The stricter resource-check limits for RSS and anonymous memory still fail after this workload; thread and idle-CPU checks pass.
Earlier desktop measurement
The 2026-10-29 optimized build measured under 80 MiB RSS and under 190 MiB video memory, about 0.1% idle CPU and 31 threads on a 4K MangoWM desktop at scale 1.5 with wallpaper, depth clock, bar, sidebar and notifications. Its sampled frame builds were typically 0.10 ms and 0.22 ms at the 95th percentile. That is a historical result from a different build and setup, not evidence of an improvement or a current upper bound.
Studio → Performance shows the shell’s own CPU, memory, video memory and frame times live, so you can check these numbers on your machine (Studio runs as its own process and is measured separately):
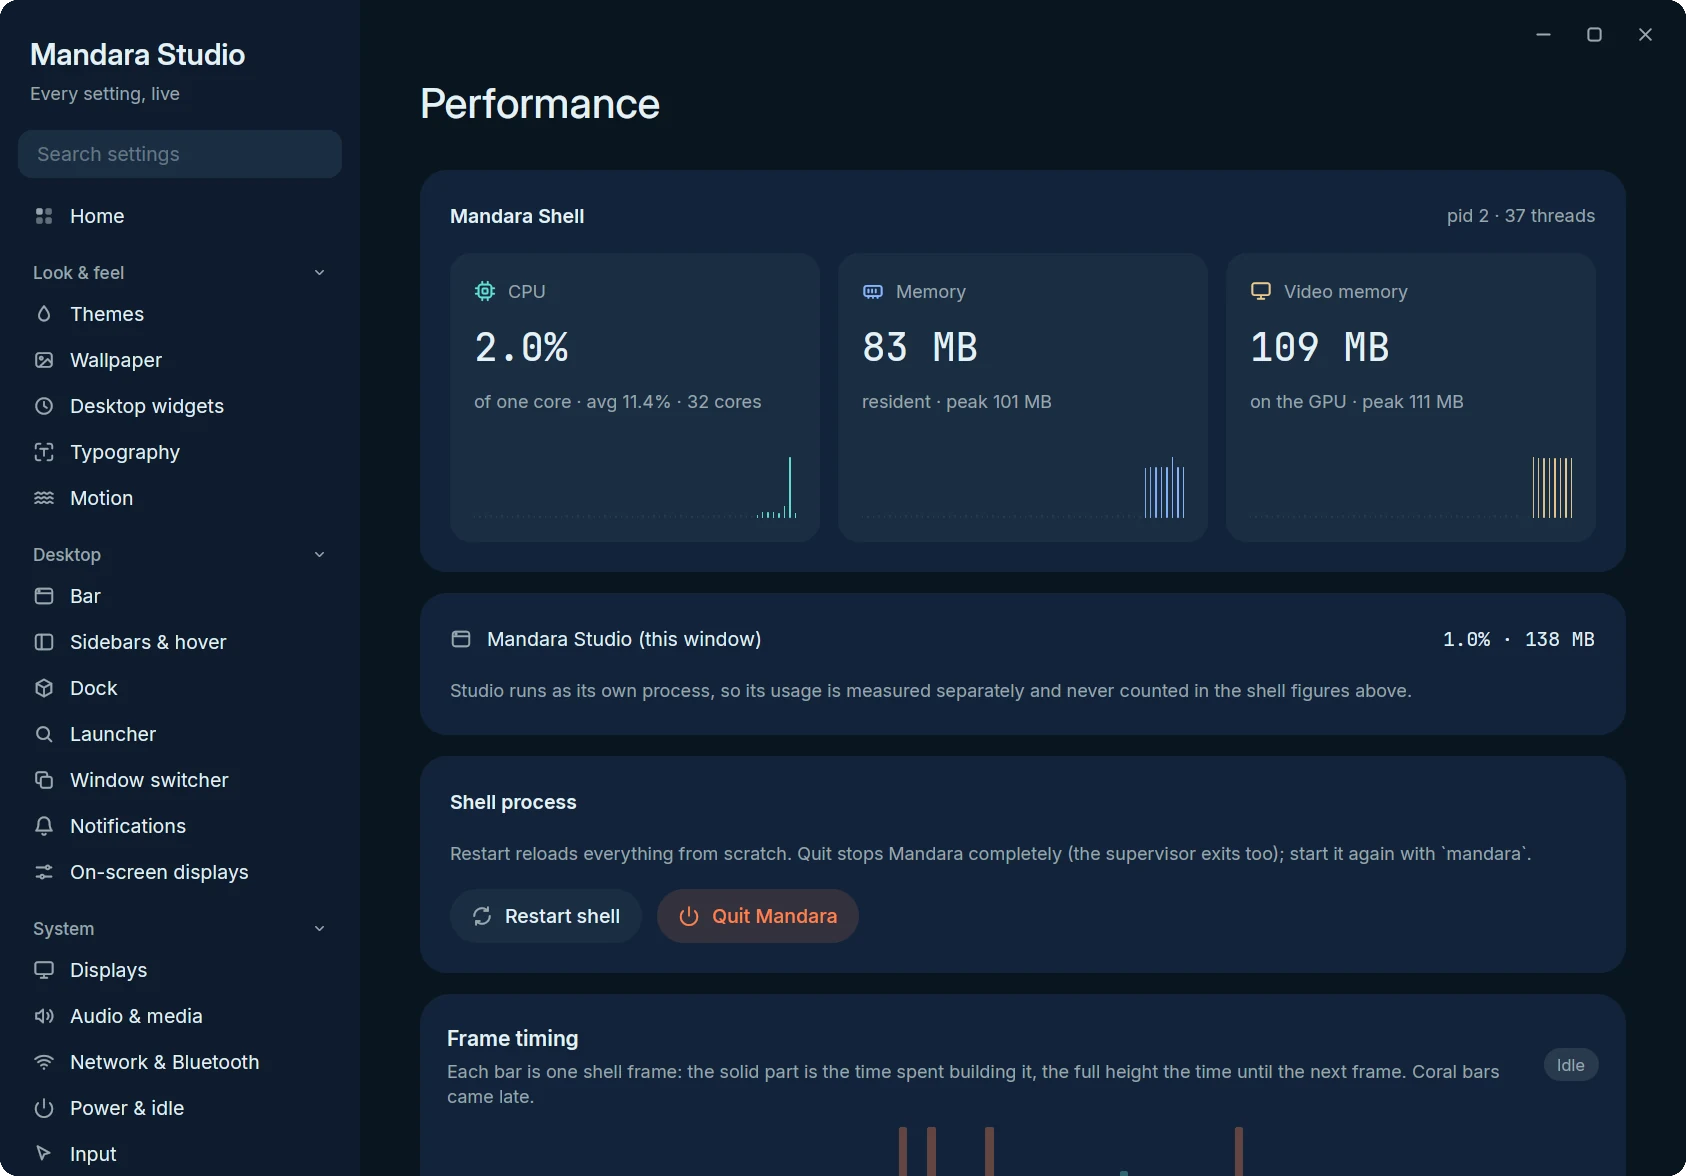
Studio → Performance in the demo session the screenshots are taken in.
The bar, dock, launcher, sidebar, notifications, wallpaper and widgets share resources through these controls:
- Hand-tuned glibc malloc. We benchmarked mimalloc v2 and v3, jemalloc
and glibc on the real shell. Tuned glibc won: at most 2 malloc arenas
(
M_ARENA_MAX) instead of one per thread, and amalloc_trim(0)every 30 seconds that hands freed pages back to the kernel. It needs no C allocator in the build. The other allocators stay one cargo feature away (numbers). - A patched GPUI renderer.
vendor/gpui_wgpuis GPUI’s wgpu renderer with six Mandara patches (details and measurements): path and anti-aliasing textures allocated lazily and sized to what is actually drawn (stock GPUI reserves ~166 MiB for a 4K surface that may never draw a path), configurable MSAA, small initial glyph/icon atlases that grow on demand, GPU suballocation blocks capped at 16 MiB instead of 64 MiB kept forever, and shaders and render pipelines built once and shared by every window instead of once per window. A full-screen shell surface needs about half the video memory of stock GPUI. - A wallpaper that costs no video memory. The desktop background is
painted in software on a separate thread into shared-memory buffers.
Crossfades run inside the compositor (
wp_alpha_modifier_v1), and once the compositor has the pixels, the shell keeps no copy. That removed a GPU window per display, about 130 MiB of swapchain at 4K. - A lean start. Fallback fonts for other scripts load one face each until text in that script appears (2 font files at start instead of 52 for an English desktop), and a wallpaper is placed on screen without full-size copies of itself (numbers). A wallpaper or depth mask smaller than the screen is scaled up one row at a time, not through a full-size float copy: a wallpaper switch on a 4K display peaks 80 MiB lower (numbers).
- Few threads. D-Bus, network and audio services share one service runtime with two workers, and GPUI’s worker pool is capped at four.
- Nothing ticks off screen. Spectrum, graphs, timers and network sampling run only while you can see them.
- Optimized releases. Fat LTO, one codegen unit, stripped symbols, and
cargo nativefor your exact CPU.
Wallpaper depth model
The depth clock’s Model mode (details) runs Depth Anything V2 Small once per wallpaper, in a helper process the shell starts and forgets, so none of its memory is ever the shell’s. Measured on a Ryzen 9 9950X while the machine was busy compiling (load around 50), with the optimized development build in the demo sandbox; the release build’s in-process model run took about 2.2 s per 4K wallpaper:
| 4K JPEG | 8K PNG | |
|---|---|---|
| Helper CPU time (one core, decode + model + write) | under 6 s | under 7 s |
| Helper wall time at idle priority | 4–17 s | 35 s |
| Helper peak memory | under 220 MiB | under 360 MiB |
| Shell after the run | no new threads, no helper left, resident memory back under its level before the run | same |
The wall time is mostly waiting: at SCHED_IDLE the helper only gets CPU
time nothing else wants. The download is 27 MB, once. A cached mask makes
every later start and wallpaper switch free; changing the clock depth
re-cuts the cached depth map without running the model.
Clipboard snapshots share immutable history between the service, panels and launcher. Editing history creates a private copy; simply opening a panel does not duplicate its text. Window previews transfer their pixel buffers to the renderer and release closed-window images on the existing window-list events.
Palette copies and color transitions share the theme name. The displayed text and saved palette format stay the same; custom names remain as written.
Input-region updates reuse their rectangle and pixel-bound buffers between frames; unchanged regions do not reach the compositor. Process sampling keeps small file buffers between updates and releases unusually large command-line buffers after each sample. CPU tables are read through a fixed-size window until EOF, so the number of CPUs is not limited by that window. These changes do not establish a new memory ceiling; the release measurements above remain the reference until the complete workload is measured again.
Snipping and eyedropper overlays reuse the captured frame instead of retaining both RGBA and BGRA copies. Public login widgets similarly keep one painted CPU buffer. GPUI uploads borrow those pixels directly until wgpu copies them into its own staging storage. Native renderer features select Vulkan and GLES; browser shader translation is excluded from Linux builds. These changes keep the existing image resolution and rendering quality.
Plugin view allocations
Clipboard rendering uses one layout for row previews and keyboard selection. Its search cache compares borrowed keys and reuses index storage tied to the immutable history snapshot; row event handlers clone their target and shared UI handle. Media seek controls retain their geometry with the gesture state, separately for panel and sidebar views. Network charts borrow the sampler’s history rather than copying its samples when labels change. Prayer times keep six time labels in an array and resolve settings once per config, language or UTC-offset change; selecting the surrounding prayers traverses the existing schedules. Album art, sharing thumbnails and dock previews consume resized image buffers; their dimensions, filters and pixel output stay the same. Temperature rows borrow paired reading and label slices, including the partial last row. Workspace labels, active-window titles, network units, world clocks and break styles parse borrowed setting text. Feed, home-control and translator settings keep owned text only for values that outlive the config read. Feed and faith plugin settings share a small config/language cache. Home controls also share non-secret settings with queued requests, avoiding copied favourite lists. The weak key lets the old config fields drop with their last strong owner, but its inline Arc allocation remains until the key is replaced or cleared; cache tests print those type sizes. Daily progress snapshots use the saved-state generation, date and week start, so hover and animation frames do not reformat the same date keys. Keyboard badges compare reported/custom labels before copying, and Phone Connect filters borrowed devices without an intermediate row list.
cargo test -p mandara-ui --test plugin_allocations -- --nocapture compares
the former temporary expressions with warm state reuse on the test thread.
It reports allocation calls and requested bytes, not process RSS. Frame and
interaction speed still need matched release measurements before describing a
performance improvement.
Bar corner geometry uses inline storage for its two joins, and capsule bounds are computed directly from visible slots. Allocation and release timing checks cover these paths; process-wide resource figures above retain their recorded build and workload scope.
Font defaults share an immutable empty OpenType feature list. Clocks and counters share their tabular-number features as well; custom edits use copy on write. Their allocation tests keep the former allocating expressions as positive controls and check wire values and independent edits. These controls measure specific operations, with release frame and resource acceptance kept separate from the allocation counts.
Plugin lifecycle watches retain only their enabled, disabled and removed lists. Other preferences compare borrowed lists and leave plugin lifetimes alone, without copying or retaining the full settings table.
Presentation mode watches only its enabled and automatic-sharing choices. Soundscapes and progress text caches include their resolved language, while progress colours resolve from the live palette. Progress grouping traverses borrowed tasks without allocating an ordering list.